February 10, 2016
In ths post, I will share a bit about what I have been up to over the past few weeks. I plan on putting up my code soon!
Getting Started
For this project, I wanted to make use of a couple things that I learned at Metis. More specifically, I was interested in using BeautifulSoup, Statsmodels, and Scikit-learn to try and predict total adjusted domestic gross from movie data scraped from boxofficemojo. One of the main objectives of the project was to try and get a sense for how to collect data and make sure that it is in a clean enough format to run analyses on.
One of the things that I realized while participating in kaggle competitions is that a lot of the time the data comes in very nice formats. Most of the major data errors are already taken care of and there isn't much if any scraping that needs to be done to get the data (I can just download the data). Therefore, I figured it would be nice to get a sense for how to web scrape then clean the data myself to understand the process more completely.
Objectives
Below are some of the objectives that I had in mind before starting the project:
- Get familiar with using BeautifulSoup to scrape web data
- Put HTML knowledge to use so that I can effectively isolate and extract the information I want from boxofficemojo
- Compare and contrast using Statsmodels and Scikit-learn to do linear regression
- Understand how and when to use transformations to variables in order to create a better model
- Experiment between Lasso, Ridge, and Elastic Net to regularize the models that are built
- Learn more about utilizing cross validation as a tool to identify the best model
Scraping the Data
The data scraping was one of the most time consuming parts of this project because it took quite a bit of time to define the business problem enough to come up with an idea of what I needed and it was also difficult at times to navigate through the nested tables (the HTML). However, BeautifulSoup made it quite simple to grab the HTML and parse through it.
More about the business problem. In order to make the project more interesting our instructors at Metis had us come up with a problem that we wanted to solve. For me, I figured I could use this the data and the model that I created to predict the total adjusted domestic gross. The motivating question for this is as a hypothetical merchandise production company (Nexus), we had already purchased rights from a couple movie studios to produce products for their movies. However, because production lines are relatively inflexible and take a while to reorganize, the business question was whether we could use a regression model to identify movies that would be more popular so that we could reorganize our production lines before crunch time (when the movies got immensely popular) to ensure that we properly allocated our resources.
With this problem in mind, it was time to start the scraping process. I decided to start by scraping as many movies as possible so that I could build out my training data set. When I looked at the a sample page on boxofficemojo, I noticed that a lot of interesting information was captured in the table at the top of each movie page. As a first step, I realized it would be quick to just take down this information.
![]()
I wrote a couple functions that used BeautifulSoup to output the HTML, then parse the HTML to extract just the information in that table. Afterwards, I stored the information in a dictionary of dictionaries (key = movie slug; values = information in the table) then I put that information into a pandas dataframe. The dict within a dict allowed me to add details to the dictionary for each movie if I decided to get more information (which I did).
I realized that if I really wanted to create a suitable training set then I needed to scrape many movies. In order to do this, I went to the alphabetical index and scraped the links of each movie (~16k) and passed each link into the previous information getting function. After these two steps, I had most of the information that I needed.
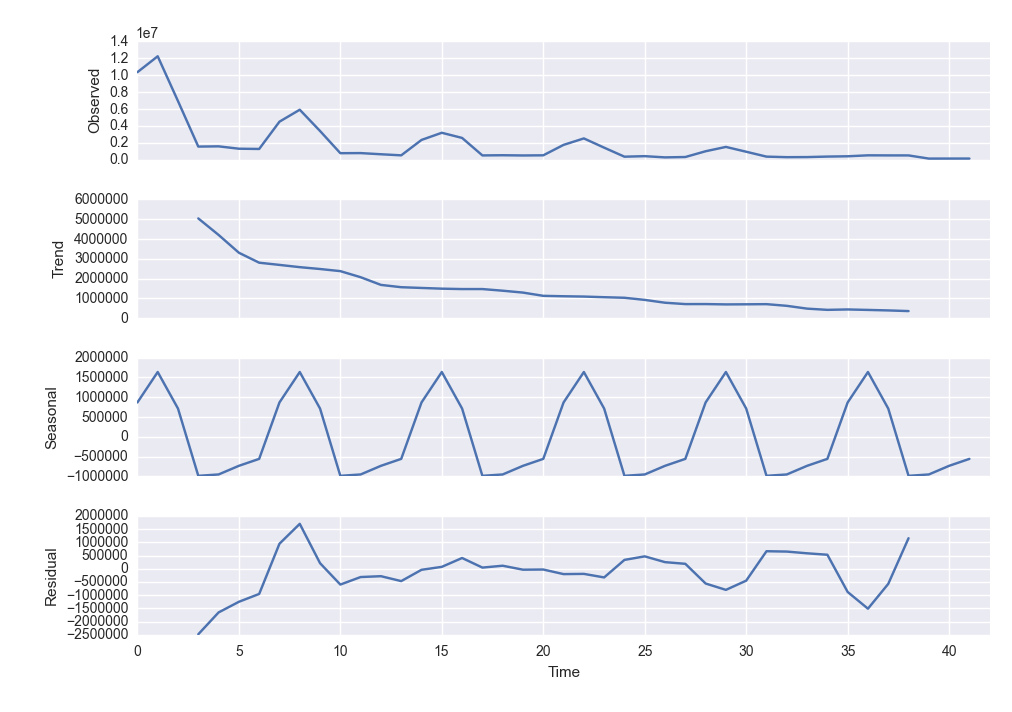
The last bit of scraping I did was to get the daily sales information and the daily theater count information. Originally I figured it would be interesting to do time series analysis on the daily sales information to predict a movie's sales and while I did try an ARIMA model I decided I would go back to that later.
Data Cleaning
The next focus was to clean the data and start thinking about how to get the model up and running. I started by importing the dataframes that I had created into my Python environment.
Then I worked with the variables to make sure that they were able to be processed
- Turning the date strings into datetime objects
- Turning the runtime string from "1 hr. 52 min." to integer format
- Getting the Month, Year, and Day for each datetime object
- Drop the NA values
- Reorder the columns
With the initial data cleaning steps completed, I moved forward to building the linear regression models.
Model Building
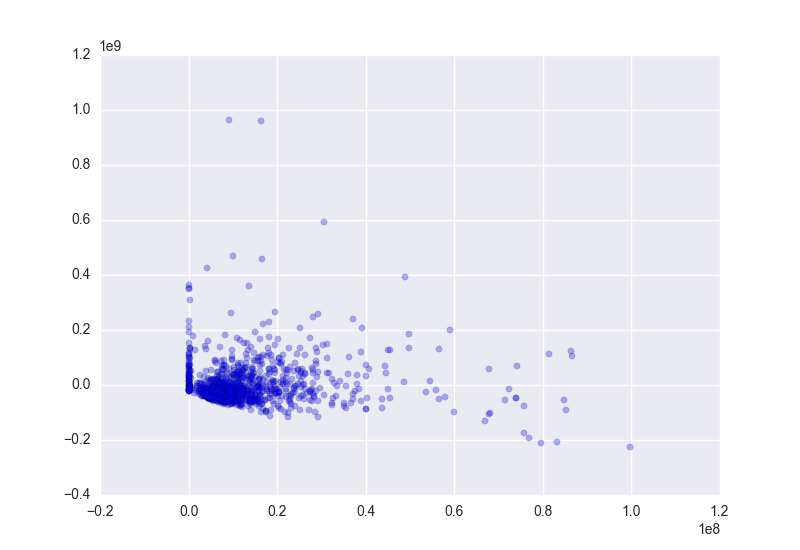
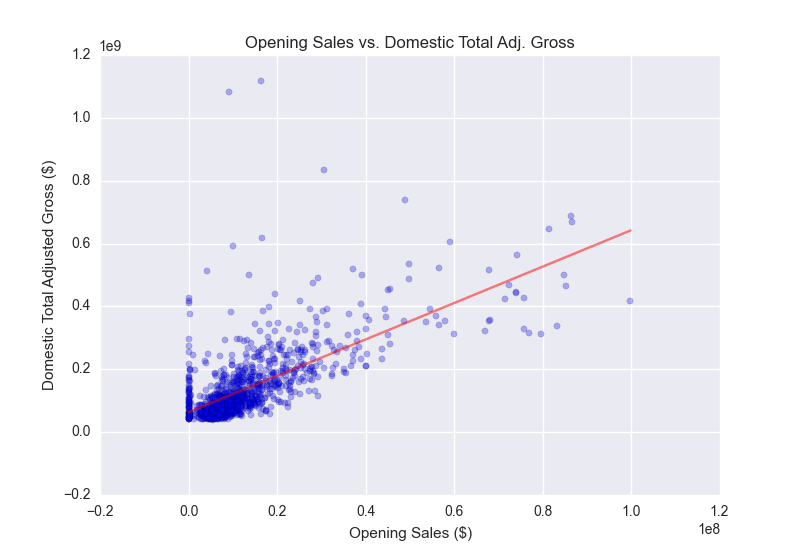
I wanted to create an initial plot to take a look at some of the data and make sure that things looked normal. I also created a residual plot just to check and see if the residuals were more or less random.
- From the initial plot it looks like there are quite a few values that are sitting right at 0, so I want to look and see what those are/ get rid of the ones that are NAs (though we should have already dropped these)
- When I looked further into this problem, it seemed like the problem was not from NAs but actually from opening sales that were exteremly small
- Further investigation showed that the very small observations were from releases at very few theaters vs. many theaters
- The residuals plot also looks a bit bunched together and definitely looks like there is some heteroscedasticity
- I decided that it might be good to transform the data to see if it could deal with some of the effect
After fitting the initial model, the adjusted R-squared was .457, which was not too horrible for a first go. I continued the process of analyzing the shape of the residuals and further transformed variables that seemed to have non-normal residuals.
Bring in more data
In order to deal with the observations that looked to bunched near 0, I brought in the number of theaters that the movie was released at to calculate the average opening sales per number of theaters.
Continuing the model building
With the new data, I continued to iterate and build models successively by tuning the parameters (mainly by plotting the residuals and looking to see if the residuals were random/ checking to see that there weren't major collinearity problems). By this time the model's adjusted R-squared was at .657.
I figured it might be good to group the genres because some of the genres were occurring realtively infrequently. So I wrote a function to standardize the number of genres. However, when I ran the regression again, the model seemed to fit the data less well so I took out the new genre variable that I created.
After performing log and exponential transformations to the dependent and some of the independent variables, the model seemed to be more or less set (at least in terms of fit of the residuals and the adjusted r-squared ~0.70).
model4 = smf.ols('exponential(Adjusted_Gross,0.1) ~ exponential(Avg_per_Theater, 0.3) + Genre + Popular_Month + exponential(Runtime, 0.5)', data = model_data_3)
result4 = model4.fit_regularized()
In the above code example, the Popular_Month independent variable is a generated binary variable based on which of the months were popular (May, June, July, November, and December).
Given that the model was explaning about ~30% more of the variance than the initial model, I felt like it was time to move to scikit-learn to do some train test splits along with cross validation to make sure that the model was performing as expected on unseen data.
Move to scikit-learn
The main reason for moving to scikit-learn at this point was to take advantage of the convenient cross validation tools.
The move to scikit-learn meant that I needed to make sure that the features were properly processed so that sklearn could take it all in. Unlike statsmodels, dummy variables are not automatically generated in sklearn so it is actually easier to generate the dummy variables using pandas.get_dummies() function. However, I made sure to delete one of the columns from each column that I was turning into dummy variables so there would not be collinearity issues.
Another benefit of using scikit-learn is that the regularized linear models are accessible and quite easy to use. I experimented with lasso, ridge, and eventually decided to use elasticnet because it makes use of both lasso and ridge regularization. (Also scikit-learn bundles cross validation and elasticnet which makes scoring and testing the models quite simple!)
In order to do cross validation, I used sklearn's train_test_split module to create 70%/30% splits of the ~900 or so observations. Then I trained the model on the 70% and performed 10-fold ElasticNetCV (with sklearn) and separately tested on the remaining 30%.
What Did I Learn
Throughout the process, I realized that I was going back and forth between many of the different models and features to figure out what combination worked the best. While I could probably have used grid search or something similar to find the best parameters and automatically build a model, it was fun to manually work through building the model step by step.
I also learned how to use BeautifulSoup to scrape data from a web page. While BeautifulSoup is a great package, I learned that it was still quite time consuming to figure out where the data actually resides.
Next Steps
Given that this project encapsulated many different aspects, I think that the main improvements and ways to continue learning is to refine each of the steps. For example:
- Web scraping: I used BeautifulSoup to scrape the web page, but I want to think about using Selenium to scrape web pages that might not have nicely laid out HTML (think information kidden behind a more interactive dynamic javascript page).
- Modeling: most of the modeling building and analyses that I performed in statsmodels and sklearn had to do with linear regression. However, there were many different features of both packages that I didn't get a chance to look at. I think it would be interesting to continue utilizing both packages for futher analyses.
- statsmodels: I performed some initial trend and seasonal decomposition in order to do time series analysis (see detrended and deseasoned graphs below!) but as mentioned earlier I decided against further looking into this for the time being.
This was a fun project that exposed me to a lot of different tools and I look forward to learning more by continuing some of the ideas that I had about how to extend the analysis!